-
 Red Ocean vs Blue Ocean Strategy
 -
Value Innovation
-
Strategy Canvas
-
Buyer Utility Map
-
Three Tiers of Noncustomers
-
Six Paths Framework
-
Four Actions Framework
-
ERRC Grid
-
Pioneer Migrator Settler Map
-
Price Corridor of the Mass
-
Sequence of Creating a Blue Ocean
-
Five Steps to a Blue Ocean Shift
-
 Three Components of Blue Ocean Shift
 -
Three Components of Humanness
-
Four Hurdles to Strategy Execution
-
Fair Process
-
Tipping Point Leadership
-
Blue Ocean Vs Conventional Leadership
-
Leadership Canvas
-
Blue Ocean Leadership Grid
-
Four-Step Blue Ocean Leadership Process
-
Cost of Disengaged Employees


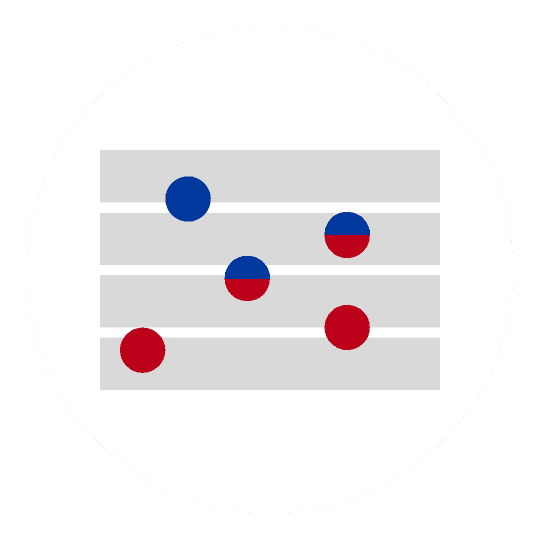


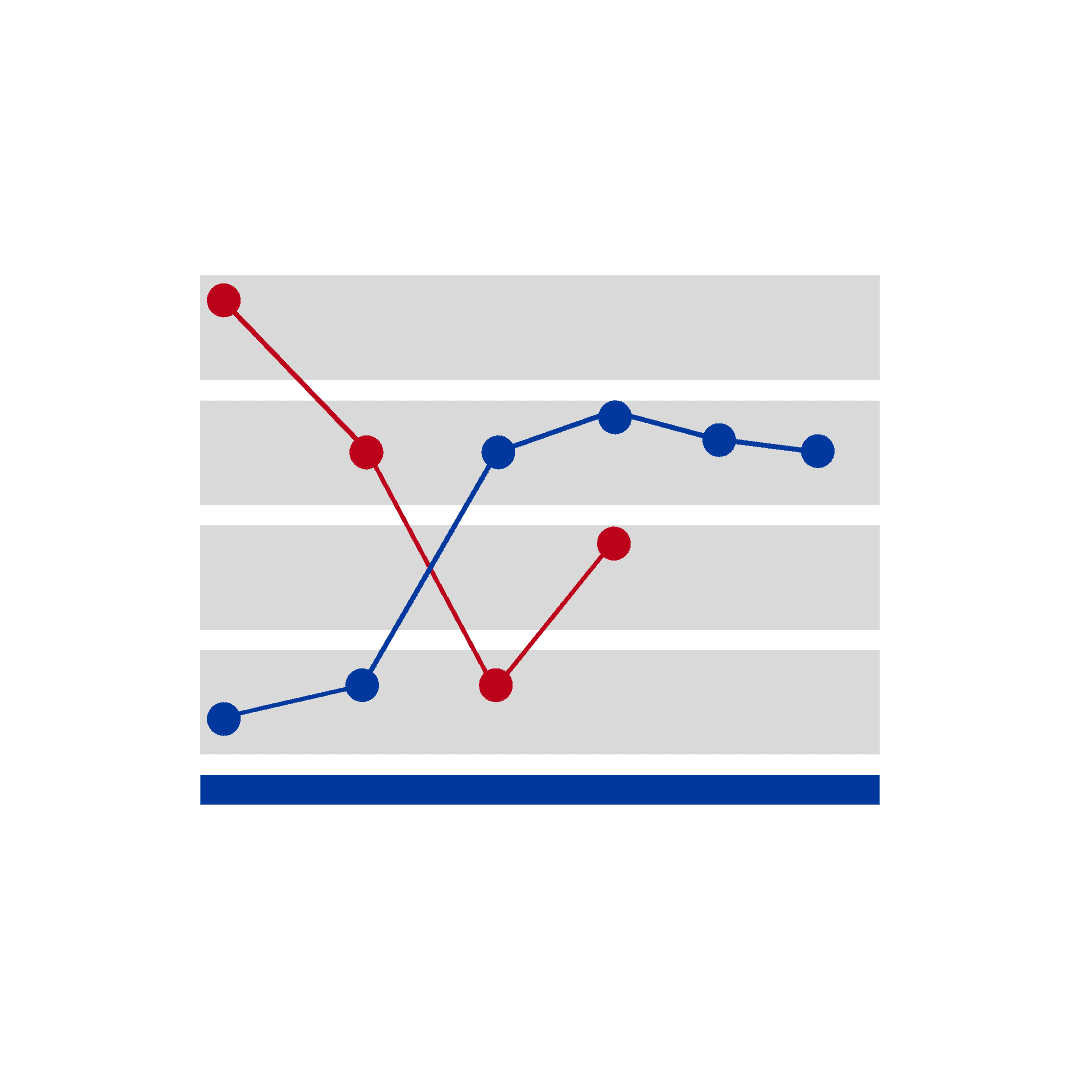


STRATEGY CANVAS
Strategy Canvas is a central diagnostic tool and an action framework for building a compelling blue ocean strategy. It graphically captures, in one simple picture, the current strategic landscape and the future prospects for an organization. The strategy canvas is developed by Chan Kim and Renée Mauborgne.
The strategy canvas is a one-page visual analytic that depicts the way an organization configures its offering to buyers in relation to those of its competitors.
It crisply communicates the four key elements of strategy: the factors of competition, the offering level buyers receive across these factors, and your own and your competitors’ strategic profiles and cost structures.
And it tells a story: It allows you to see – and understand – where you and your competitors are currently investing; the product, service, and delivery factors the industry is competing on; and what customers receive from existing competitive offerings.

© Chan Kim & Renee Mauborgne. All rights reserved.
The horizontal axis on the strategy canvas captures the range of factors that an industry competes on and invests in, while the vertical axis captures the offering level that buyers receive across all of these key competing factors.
A value curve or strategic profile is the graphic depiction of a company’s relative performance across its industry’s factors of competition.
The strategy canvas allows your organization to see in one simple picture all the factors an industry competes on and invests in, what buyers receive, and what the strategic profiles of the major players are. It exposes just how similar the players’ strategies look to buyers and reveals how they drive the industry toward the red ocean. Importantly, it creates a commonly owned baseline for change.
The strategy canvas serves two purposes:
- It captures the current state of play in the known market space, which allows users to clearly see the factors that an industry competes on and invests in, what buyers receive, and what the strategic profiles of the major players are.
- It propels users to action by reorienting their focus from competitors to alternatives and from customers to noncustomers of the industry and allows you to visualize how a blue ocean strategic move breaks away from the existing red ocean reality.
Use our interactive tool to draw your strategy canvas

STRATEGY CANVAS EXAMPLES
See examples of strategy canvases in various industries and learn how organizations around the world created their blue ocean strategy. Learn from CitizenM, YellowTail, Apple, or Comic Relief, and more.
5 Strategy Canvas Examples
DRAWING YOUR STRATEGY CANVAS
Learn how to draw a strategy canvas for your organization today. Get the strategy canvas template and a step-by-step tutorial on how to draw it.
Strategy Canvas Template
-
Red Ocean vs Blue Ocean Strategy
-
Value Innovation
-
Strategy Canvas
-
Buyer Utility Map
-
Three Tiers of Noncustomers
-
Six Paths Framework
-
Four Actions Framework
-
ERRC Grid
-
Pioneer Migrator Settle Map
-
Price Corridor of the Mass
-
Sequence of Creating a Blue Ocean
-
Five Steps to a Blue Ocean Shift
-
Three Components of Blue Ocean Shift
-
Three Components of Humanness
-
Four Hurdles to Strategy Execution
-
Fair Process
-
Tipping Point Leadership
-
Blue Ocean Vs Conventional Leadership
-
Leadership Canvas
-
Blue Ocean Leadership Grid
-
Four-Step Blue Ocean Leadership Process
-
Cost of Disengaged Employees
The Blue Ocean Strategy Practitioner Program
Apply blue ocean strategy to your business, get expert feedback, and unlock new growth opportunities.
"The Blue Ocean Strategy Practitioner Program was an enlightening journey for me. It equipped me with tools to approach market challenges creatively."
For senior leaders, business owners, and consultants taking on a specific strategic challenge: finding a way to grow, breaking out of stagnating competition, launching a new venture, or strengthening a consulting practice.
Bring a real problem and work step-by-step through the blue ocean process to create new market space and growth, with the confidence to systematically apply the methodology again, on your own.